I really like this little intro activity for circumference from Andrew Stadel. I think any time that you can pull at students misconceptions then its a good thing. In this case its the disconnect between the size of the diameter and the size of the circumference. The vehicle is a bet about how high a glass is compared to how round. In my own class I would probably do this live and have several glasses and cylinders to have students eventually discover that the circumference is a little more than 3 times the diameter.
Curriculum Tags: Gr8 http://mr-stadel.blogspot.ca/2014/05/going-round-in-circles.html
Here is a neat idea for making tedious calculations a bit more palatable. Play the Would You Rather game. Give them a scenario and then have them choose based on two choices within that scenario. Thanks to Dan Meyer for this one.
Curriculum Tags: All http://mrjonesmath.wordpress.com/2014/05/01/day-2-of-state-testing/
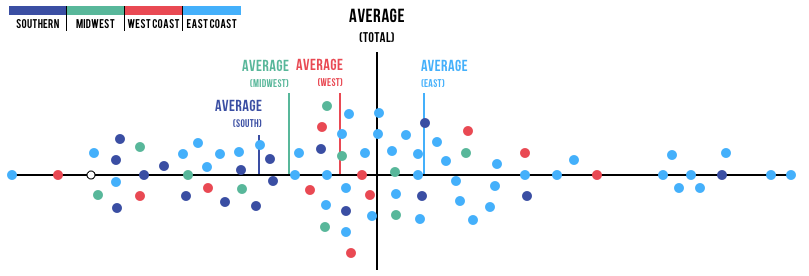
Fawn Nguyen has done a great job of summarizing the data from the McDonalds Monopoly game. She includes the spreadsheet for analysis all the prizes. For the younger grades (7&8) you can just concentrate on the odds and some anecdotal stuff but for grade 12 students you can extend to expected value. One of the things that I like that she did was tried to compare the prize purse for Canada and the US and found that indeed they are somewhat proportional.
Curriculum Tags: Gr7, Gr8, MBF3C, MDM4U http://fawnnguyen.com/2014/05/04/mcdonalds-monopoly-game.aspx
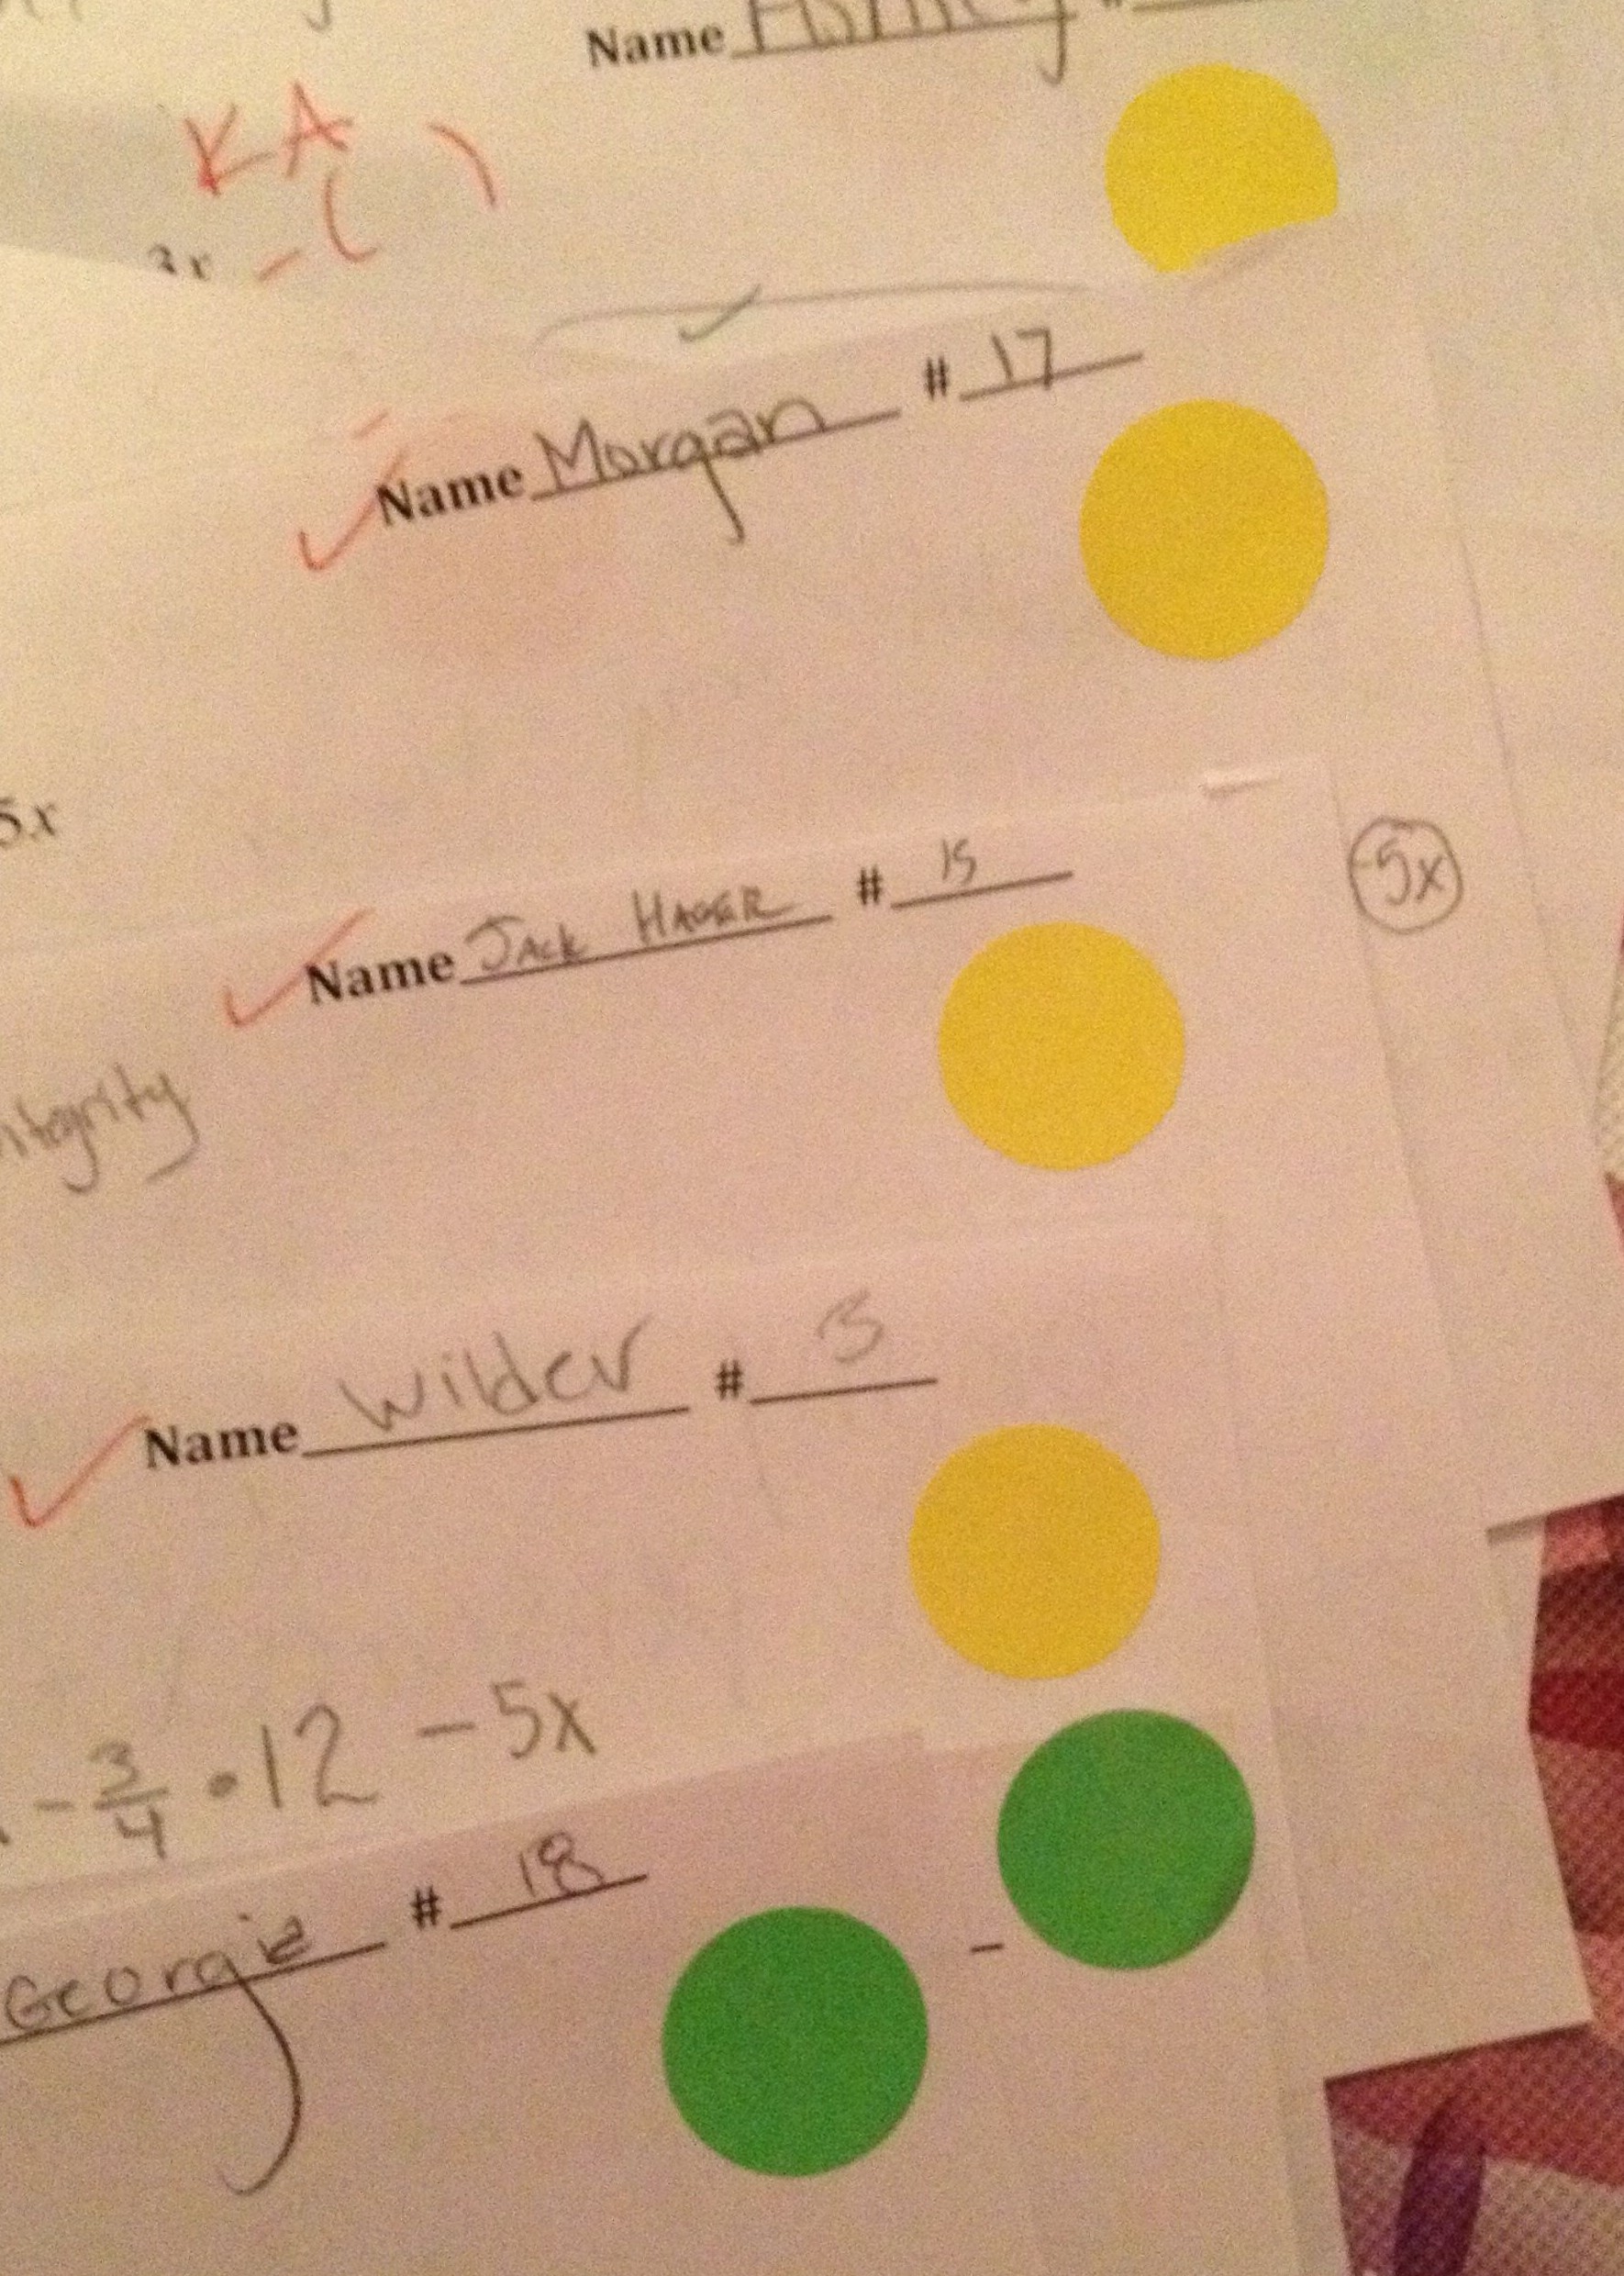
Now some may poo poo having kids use stickers to indicate how they are doing but when ever you can get kids to self assess then you are actually helping them move forward cognitively. So having kids indicate how they thought they did on an assessment is a step in that direction. We have had success in doing this with learning goals but here Check out how Julie has done that in her class here.
Curriculum Tags: All http://ispeakmath.org/2014/05/21/stickers-for-self-assessment/
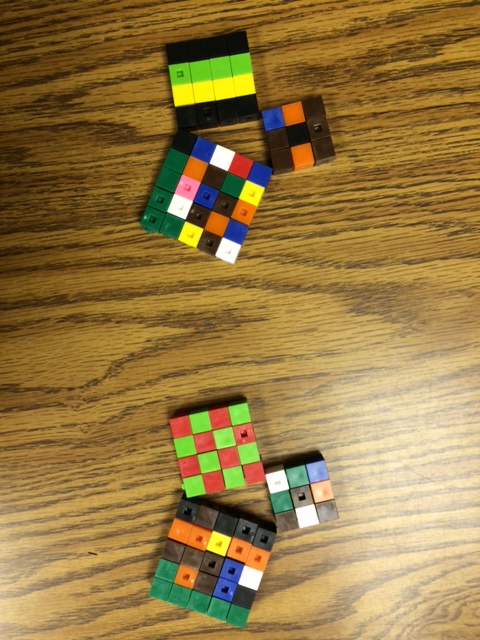
I really like sorting activities. And this one is from the Shell Centre was pointed out by Mary at the M^3 blog. It's about sorting different representations of simple polynomial functions (including factored and non factored forms). She spread out the images and text over two posts and I like how she showed some student work that had mistakes in it. You can get the templates of the handouts here.
Curriculum Tags: MPM1D, MFM2P http://marybourassa.blogspot.ca/2014/05/day-68.html http://marybourassa.blogspot.ca/2014/05/day-69.html
How many bird craps does it take to crush a Smart Car? You had me at "bird crap" Mr. Orr. I love this 3Act task that can be used for proportional reasoning. I also love that in the course of the Tweeting and such, Smart actually responded with an info graphic of how many craps it would take from various birds.
Curriculum Tags: Gr7, Gr8, MPM1D, MFM1P http://mrorr-isageek.com/?p=3046
And another one from Mr. Orr. This time that classic question of calculating the distance from one corner to the opposite corner of a box. Done as a 3acts, this would be fine for any class working on Pythagorean theorem.
Curriculum Tags, Gr8, MPM1D, MFM1P http://mrorr-isageek.com/?p=3028
I am a big fan of personal white boards for students. And John Scammell has done a nice job talking about what he has learned about using them in classes. Here are his pros:
How their work “pops” off the boards so that I can see it easily. As I circulate, it’s so easy to provide feedback.
How comfortable students are working on a dry-erase surface. They are not afraid to try things. They are not afraid to make mistakes.
How easy it is to group and pair students to give and receive feedback from peers when their work is on whiteboards.
And if we are going to talk about personal whiteboards we might as well talk about the electronic version. That is, using apps like Educreations, Explain Everything, Doceri etc. I wasn't able to see her session but Dan Meyer saw Marion Small talk about how to use one of these apps to capture student thinking. So as student solve a problem, they record what they are thinking with the app (including all the problems and mistakes). In this way, when you review the recording you can get a better idea of misconceptions that a student might have. And I like the street cred that Dan brings here as one of the creators of Educreations was actually participating in the comment section.
Curriculum Tags: All http://blog.mrmeyer.com/2014/the-most-interesting-use-of-educreations/
And while we are on the Dan Meyer train, we might as well talk about this new 3Act task that is about expected value.
Curriculum Tags: MDM4U http://blog.mrmeyer.com/2014/3acts-money-duck/
And we might as well finish of with a quote that Dan made at the workshop he gave in Windsor last week that seemed to have a lot of play on the Twitter.
Curriculum Tags: All
"If you got into math teaching because you were good at math then it's tough to understand why kids struggle" - @ddmeyer#oame#mathchat
— David Petro (@davidpetro314) May 17, 2014
A few weeks back I spoke some of the discussion going on on the web about Common Core and "New Math". Here is a nice video that kinda sums it up, I think. Thanks to Cathy Yenca for this one
Curriculum Tags: All https://www.youtube.com/watch?v=q0aeyAN0Axo
And finally this week, Randal Munroe's (XKCD,What if) TED talk on his What If website. The best thing about this site (there are many good things) is the fact that he is basically using the Fermi problem as the estimation method.
Curriculum Tags:All https://www.youtube.com/watch?v=I64CQp6z0Pk
I am a big fan of collecting data. I also like when the data is dirty and imperfect. This activity from Slam Dunk Math has all of that an more. Here is the Reader's Digest version. Get a box and some playing cards. Have each person throw one card at time into the box from a fixed distance for 30 s (or so). Repeat and get an average rate of cards in the box per second for each student. Then compare your's (hopefully its better) to the students and have a conversation about who would win, giving head starts etc. There is a lot of stuff here: rates, averages, direct & partial variation, intersection of lines. Perfect for any grade 9 class. Thanks to @MaryBourassa for pointing this one out to me.
Curriculum Tags: MPM1D, MFM1P, MFM2P http://slamdunkmath.blogspot.ca/2014/05/card-tossing.html
The confusion between correlation and causation is actually a big issue. So often the two are use synonymously. What better way to help distinguish the two then by showing how easy it is to get two related things to correlate. Enter Spurious Correlations. A blog that shows a new questionable correlation each day. So far I think this might be my favourite "The age of Miss America correlates with the number of murders by steam, hot vapours and hot objects" (correlation = 0.87). Thanks to Mike Lieff for this one.
Curriculum Tags: MDM4U, MAP4C http://www.tylervigen.com/
So this article was in our local paper about the number of Sex Offenders that are residing in the area. I think its a perfect example of scare tactics because without any information on the population sizes and the average rate of residence for sex offenders its hard to tell if these numbers are high or low. So I did a quick study of the populations of the communities listed and came up with these results (comparing to Windsor). I also included the proportional rate of SOs for each town if their population was scaled up to the size of Windsor
City/Town Population #SOs #SOs if the same size of Windsor
Another proportional reasoning type link relating to data. One of the issues with the, so called, debate on climate change is that often when there is a public debate, there is usually one person on each side of the fence. This gives an impression that there is a 50/50 split between the two groups. When, in fact, there is about 97% of the scientific community that believe its happening. So John Oliver tried to remedy that on his new show. Thanks to Mark Esping for this one. Keep in mind there is language in this so you may want to show this from about 2 minutes in.
Curriculum Tags: MDM4U https://www.youtube.com/watch?v=cjuGCJJUGsg
Today I did an Ignite presentation at the OAME 2014 conference. There were 10 of us (Ruth Beatty, Cathy Bruce, George Couros, George Hart, Ron Lancaster, Amy Lin, Dan Meyer, Marian Small, Chris Suurtamm. and me) and we all get 5 minutes (20 slides at 15 seconds each) to talk about any topic we want. I chose to speak on recreational reading for math teachers. That is, books you could read to help bring interesting and relevant ideas into your math classes. I basically spoke for 5 minutes straight and apparently there will be video available soon but here is the slide deck:
Curriculum Tags: All http://bit.ly/oame2014ignitepetro
Last week I talked about Alex Belos's books about numbers and this week he's on RadioLab doing the same thing. Such a well produced show. Listen here.
Curriculum Tags: All http://www.radiolab.org/story/love-numbers/
Do you like puzzles and logic. Then you probably like recreational math. This is the first issue of Recreational Math Magazine. Some classic problems and maybe some you have never seen.
A few weeks ago I mentioned the new-ish game 2048. I like how the Making Math Meaningful blog has taken that game and extended it by collecting data on the solutions. That is, the game works on the principal of doubling (they go through the premiss) and then collected data on how long it took them to get to the various levels (2, 4, 8, 16, .......). And not surprising (to math teachers I hope) the data has an exponential shape. Perfect if you are trying to match real life to exponential functions.
Curriculum Tags: MCR3U, MHF4U, MAP4C http://marybourassa.blogspot.ca/2014/04/2048.html
I like these two different activities from Fawn Nguyen. The first concerns area unit conversions. Most humans don't have a really good handle on doing this and Fawn uses a role of toilet paper to make this a little more palatable for the students. The other activity is a great linear relations context. Figuring out how much it would cost to take a Taxi given the following rule (see image). Take a look at the blog post for more info.
Curriculum Tags: Gr7, Gr8, MFM1P, MPM1D http://fawnnguyen.com/2014/04/22/tp-and-taxi-rate.aspx
New from Numberphile is a mathematical fable. This one is about the geometric representation of the Pythagorean theorem (with some similar figures included). You can also check out my GSP sketch on the same thing here.
Curriculum Tags: Gr8, MPM1D, MFM1P https://www.youtube.com/watch?v=ItiFO5y36kw
I am always looking for interesting data sets displayed in interesting ways. This one looks at how verbose various rap artists are by looking up how many different words they use in the first 35,000 lyrics that they released. Then it displays it in a dynamic dot plot (go to the website for that). It even throws in where Shakespeare would be if he was a rapper.
Curriculum Tags: MDM4U http://rappers.mdaniels.com.s3-website-us-east-1.amazonaws.com/
More than 30,000 people were surveyed and asked what their favourite number was. Spoiler alert, it was 7. Or more specifically, of all the numbers that people suggested as their favourite (there were over 1100), 7 came up the most (9.7% of people chose it) and 3 came up 2nd (7.5% of people chose it). This is what Alex Bellos found and you can download the entire Excel spreadsheet here (I do love data sets). Perfect for any data management class. It really is interesting what numbers people chose and how many chose each. And don't forget to check out Alex's books Alex Through the Looking Glass (called the Grapes of Math in NA) & Alex's Adventures in Numberland
Curriculum Tags: Gr7, Gr8, MBF3C, MDM4U http://pages.bloomsbury.com/favouritenumber
A couple from Nate Silver. The first is about what the statistics tell us about the flipped diversity between owners of professional teams and their players. Any data we can get about sports can help us capture the interest of some of our sport minded students.
Curriculum Tags: Gr7, Gr8, MBF3C, MDM4U http://fivethirtyeight.com/datalab/diversity-in-the-nba-the-nfl-and-mlb/
The second link from Nate Silver really hits at the heart of using proper sampling. Here a poll tried to gauge the interest of the US population that were interested in the World Cup. However, they only conducted the poll in english and so it suffered from Non response bias from the large Hispanic population that may only speak Spanish. You can see why this is significant when you see the results of the Hispanics that did answer the poll and how they outnumber every other ethnic group.
Read about all the details here.
Curriculum Tags: MDM4U http://fivethirtyeight.com/features/to-gauge-americans-interest-in-the-world-cup-ask-some-people-in-spanish/
I really like this calculus app. In it you are given a particular function and then asked to trace out the derivative. A really neat concept. I also like how it scores your attempt (yay for me, I got 95% accuracy on my last attempt). My biggest complaint is that its flashed based. So iPads are out. But if you have a flash ready tablet, then you are good to go. I think this is important because I think any "tracing" app is hard to actually do with a mouse so a tablet is really helpful. Thanks to Mark Esping for this one.
Curriculum Tags: MCV4U http://www.flashandmath.com/mathlets/calc/derdraw/DerivativeDraw.html
I like watching Sunday Morning on CBS but last week they revealed their math chops. Here is something you can bring up when talking about polls or even when you are trying to teach the fact that if you are trying to measure percents of a whole, those percents should add up to no more than 100. I thought maybe there was a venn diagram in there somewhere that made those numbers make sense but I don't think there is.