Curriculum Tags: All
http://clotheslinemath.com/
 As mentioned @MaryBourassa has been experimenting with clotheslines and in these two posts, doing so with logs. Really, anything that you can calculate, get a numerical value and then order, can then be put on a number line. In her first post she outlines the idea for using logs and has all of the downloads and in the second post it is after she ran the activity and gives the pros, cons and changes.
Curriculum Tags: MHF4U, MCV4U
http://marybourassa.blogspot.ca/2016/02/log-clothesline.html
http://marybourassa.blogspot.ca/2016/02/log-clothesline-my-post-activity-post.html
 I love this game. Many kids (and humans in general) can't "eyeball" correlation. In this game, created by @omarwagih, (which has a great Atari 2600 feel) you are given a scatterplot and asked to estimate the correlation and then you are given points on how close you are to the actual correlation. It is surprisingly addictive. Don't blame me if you can't stop.
thanks to Michael Lieff for this one
http://guessthecorrelation.com/
 I love when teachers do a good job with Desmos activities. Often I am guilty of just building stuff that is functional and ignores aesthetics but this activity from @MrOrr_Geek doesn't. It's an activity that covers expectations about rates of change as well as describing the contextual meaning of points by using sugary cereal.
Curriculum Tags: MPM1D, MFM1P
https://teacher.desmos.com/activitybuilder/custom/56c305acfcfd640056b23805
Do you want to get your kids interested in data management? Then you should tell them how much money they might be able to make as a data scientist. I think in past years we might have called it being a statistician but apparently now data scientists are considered "sexy" jobs. And sexy jobs that have salaries that start north of $100K and are at some of the coolest places to work (Apple, Airbnb, Twitter etc). This of course would be no surprise to @HansRosling who sent the following Tweet out in 2011. Thanks to @Mark_Esping for this one.
Curriculum Tags:All
https://ca.finance.yahoo.com/news/heres-much-money-sexiest-job-195900295.html
CNN got it wrong; Graphics are not about "How to make data look sexy", but to reveal that data is sexy! http://is.gd/aJY1kW— Hans Rosling (@HansRosling) April 20, 2011
This would have been more appropriate during the Christmas Holidays but, hey I just saw this video from @MathyCathy on how to create a fractal based card. I made one and it turns out that it's pretty easy. If you want more ideas you can go to
Curriculum Tags: All
https://www.youtube.com/watch?v=4YDHsMUQbVg
A nice graphic highlighting all of the NHL Stanley Cup winners. Perfect for some data management inferencing (eg "I infer that the Maple Leafs used to be a really good team - until I was born :-) ). Thanks to @mathletepearce for this one
Curriculum Tags: Gr7, Gr8, MDM4U
https://scontent-yyz1-1.xx.fbcdn.net/hphotos-xlp1/v/t1.0-9/12728860_1684142441803284_5627299127368925474_n.jpg?oh=a40ea533a1850272b9cdf270b0efee34&oe=575F0295
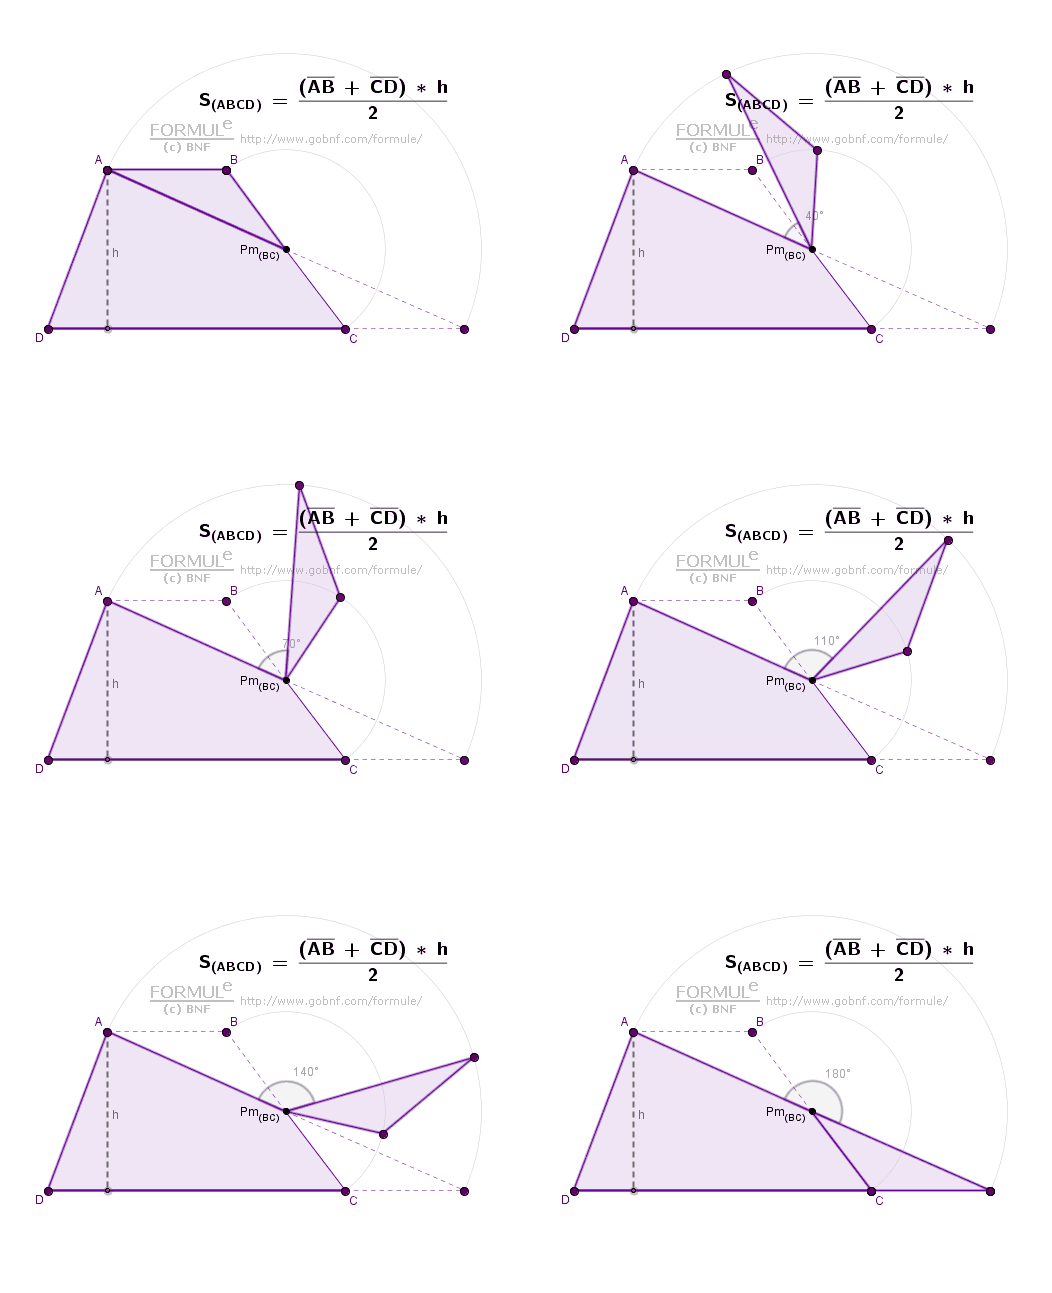
This is a totally cool animated gif that shows the development of the formula for area of a trapezoid and how it relates to the area of a triangle. So awesome. Thanks to @mathletepearce for this one
Curriculum Tags: Gr7
https://lh3.googleusercontent.com/-y1rQw-RUqz8/UsqsADNMe_I/AAAAAAAAFnA/LuJ0ZUI8v3M/w526-h431-no/AreaTrapezoid%26Triangle.gif
Yup, and another "Only for geniuses" question on order of operation.
Curriculum Tags: Gr7, Gr8
https://scontent-yyz1-1.xx.fbcdn.net/hphotos-xft1/v/t1.0-0/p600x600/12507303_1680850385491113_754382913410650201_n.jpg?oh=183afebd9c68364b49a1fb3ef78e5e67&oe=5722ADF9


