

 I love real stories of data and statistics. Especially if those stories are well produced. In both grade 7&8 as well as grade 12 MDM4U and MAP4C students are to conduct and discuss surveys. This story is the back story of the now famous 2000 US presidential elections and how the final result basically came down to a recount in one county. One of the interesting parts is how poorly designed the ballot was and how it was easy to vote for Pat Buchannon instead of Al Gore without realizing it. And then the stats that seem to corroborate that that, in fact, happened. I think it's important for students to hear real stories like this to help show why we want the details of things like surveys are important for collecting good statistics.
Curriculum Tags: Gr7, Gr8, MDM4U, MAP4C
http://99percentinvisible.org/episode/butterfly-effects/

 I like this little lesson on sums of arithmetic series. It's not super elaborate but just a simple observation on starting the thinking about sums without getting too mathy (but then eventually getting mathy). I like the idea that it just starts in a way that is totally achievable for most and then gets more complex
Curriculum Tags: MCR3U
https://betterqs.wordpress.com/2015/10/29/opening-question/
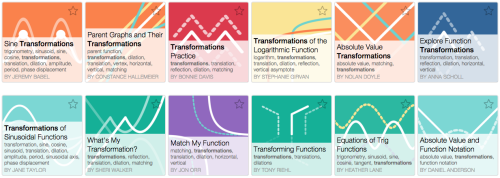 As promised, Desmos was going to start taking those Activity Builder activities and cleaning them up and giving some extra polish. Their latest post highlights all of the current activities on Transformations (some that have previously been mentioned here) Check them all out at the link below (and then try them out on Desmos)
Curriculum Tags: MPM2D, MFM2P, MCR3U, MCF3M, MBF3C
http://blog.desmos.com/post/132423138557/activity-of-the-week-transformations
A couple of posts from 538 about movies. I love movies as a source of data. We all love them and there are so many sources where we can get data to show all kinds of things. The first is one that compares movies that were made from books and the books they were made from and then takes it a step further to talk about the outliers. It uses data from Rotten Tomatoes (for the movies) and Goodreads (for the books). A perfect example of data mining
Curriculum Tags: MDM4U
http://fivethirtyeight.com/features/the-20-most-extreme-cases-of-the-book-was-better-than-the-movie/

The second from 538 about movies is specifically about Sandra Bullock and her movies' ratings on Rotten Tomatoes and how much they grossed from The Numbers. Again great data mining and showing how to collect data from many sources to come up with a unique set of content.
Curriculum Tags: MDM4U
http://fivethirtyeight.com/features/the-three-types-of-sandra-bullock-movies/


 The idea that we have to give kids a reason to need to do math has intrigued me recently. It could be @ddmeyer's "if ______ is the asperin, then we have to create the headache" analogy for this that started it off. Now @mrOrr_Geek has his own take on this with his hero's journey idea. That idea that students have to have that journey in order to be encouraged to do math. The good news is that we have so many tools now to help give that journey to them. Take a look at where they could be found here.
Curriculum Tags: All
http://mrorr-isageek.com/promote-struggle-a-heros-journey-in-math-class/
Guess what? Mathematics is like poetry. Duh
Curriculum Tags: All
http://poetrywithmathematics.blogspot.ca/2015/10/mathematics-and-poetry-are-similar.html

 Hey, they found a connection between Pi and Quantum mechanics. Thanks to Mark Esping for this one.
Curriculum Tags: All
http://phys.org/news/2015-11-derivation-pi-links-quantum-physics.html
http://www.sciencealert.com/a-classic-formula-for-pi-has-been-discovered-hidden-in-hydrogen-atoms
 I have always been quick to link math anxiety with poor math performance. But there seems to be research to suggest that that doesn't have to be the case. Read on
Curriculum Tags: All
http://www.sciencedaily.com/releases/2015/11/151104124650.htm
 I love that there is a history of just about all mathematics. Even statistical regression. Thanks @mathtans for pointing this out.
Curriculum Tags: MDM4U, MAP4C
http://priceonomics.com/the-discovery-of-statistical-regression/

Curriculum Tags: All
https://www.youtube.com/watch?v=MS2aEfbEi7s
In general, I don't like to feature "teaching" videos but this one from @standupmaths is a follow up to one I featured a couple of weeks ago on the UK lottery. In this one he goes into more detail on factorial and combinatorics and how that relates to the lottery.
Curriculum Tags: MDM4U
https://www.youtube.com/watch?v=lP58mP8Wchc
We talk about misleading graphs in Gr7, MBF3C, and MDM4U and often mention the idea of how by messing with the y axis of a graph you can make it very misleading. But this video does an interesting thing. It talks about why you actually might want to mess with the y axis and starts with a reference to one of my favourite books, How to Lie with Statistics. Thanks to Michael Bortalin for this one.
Curriculum: Gr7, MBF3C, MDM4U
https://www.youtube.com/watch?v=14VYnFhBKcY

Curriculum Tags: Gr7, Gr8
https://twitter.com/stwillott/status/665956957161971712/photo/1
Hey, Kate Spade, why not just say 60% off? #mathchat pic.twitter.com/SoT8oyGJhd
— Steven Willott (@stwillott) November 15, 2015

No comments:
Post a Comment