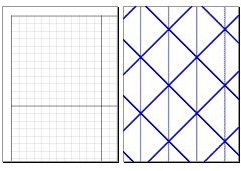
Speed dating and Row games are two really nice activities to promote kids doing questions and then self checking whether they are correct or not. I first learned about these from @k8nowak on her Function of Time blog a few years ago. I was recently reminded of them when @thescamdog tweeted that they have a little video introduction to these on their provincial math site in Alberta. Speed dating has students become experts in the solution for one question each. They are then paired sitting across from each other and switch question. Once that question is solved then they shift one position and switch with another student. Row games has students paired with a worksheet where there are two columns of questions and each student does the question in one column. The beauty of the worksheet is that the answer for each question in any particular row is the same so that if the students get different answers they know that one or both of them has made a mistake. Thus it's self checking.
Curriculum Tags: All
http://www.aac.ab.ca/projects-grants/high-school-mathematics/#FormativeAssessmentRowGamesandSpeedDatingvideo-6

 How about some data on the lyrics that boy bands of the 90's used the most. Yep, there's data on that. Hey, data is data. This could easily be used for central tendancy, bar graphs, or even box plots.
 Curriculum Tags: Gr7, Gr8, MBF3C, MDM4U
http://fivethirtyeight.com/datalab/90s-boy-band-lyrics-theyre-all-about-you/
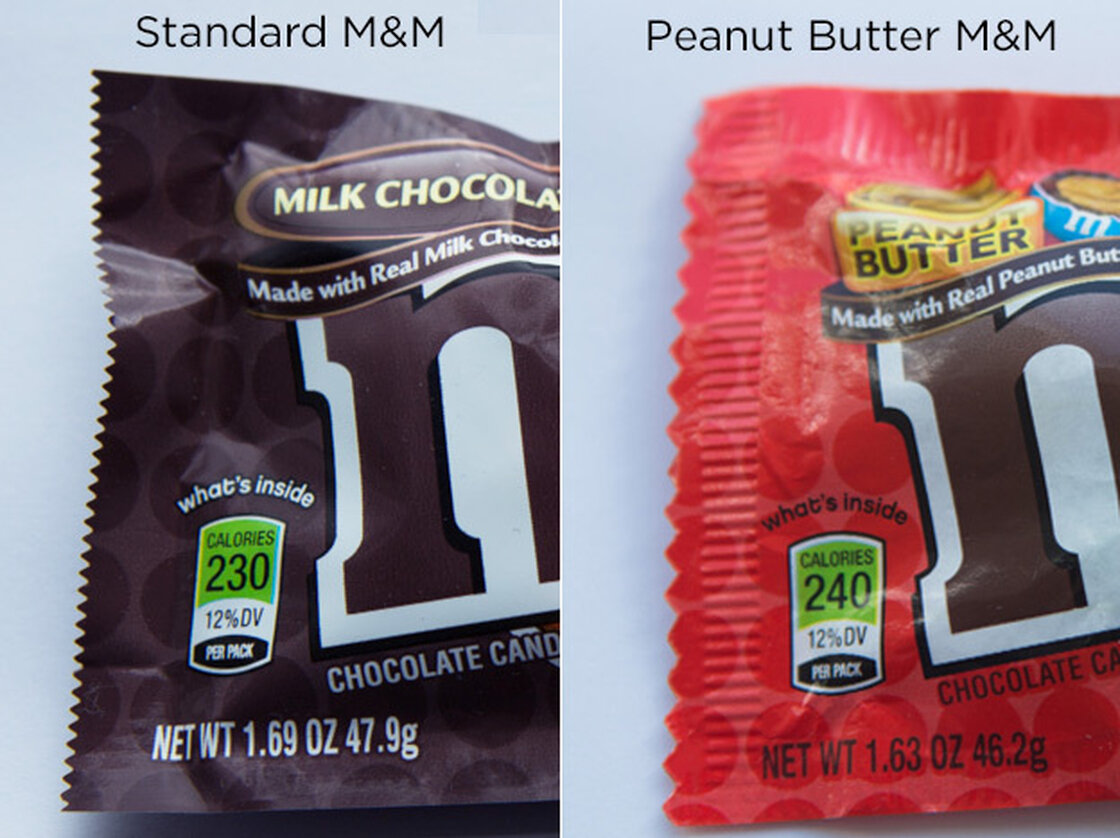 I like collecting real data in classes, and so I was thrilled with a reason to do so. That is, the mystery of why there are different weights of regular M&Ms vs Peanut Butter M&Ms per bag. The actual reason is a bit of a mystery and you can listen about that mystery with the Planet Money podcast here . But collecting data about how many M&Ms are in each pack (or how much each pack weighs in reality) is a good way to talk about measures of central tendency, dot plots, and standard deviation.
Curriculum Tags: Gr7, Gr8, MBF3C, MDM4U
http://www.npr.org/blogs/money/2014/06/05/319084976/why-a-pack-of-peanut-butter-m-ms-weighs-a-tiny-bit-less-than-a-regular-pack
 Though this is a couple of years old, I just came across it today. Math Goes to the Movies is a book that connects scenes in movies to teaching specific math concepts. Having done presentations on this sort of thing at OAME, I am interested to see what they have found that I haven't
Curriculum Tags:All
https://jhupbooks.press.jhu.edu/content/math-goes-movies

Math anxiety is real. We have all seen kids who suffer from it. Here are some ways to combat this problem.
Curriculum Tags: All

Mixing dance and math to entice girls in an after school program.
Curriculum Tags: All
http://www.bostonglobe.com/news/science/2014/04/18/after-school-program-uses-dance-nurture-girls-interest-math/JmszMn1zOR7DPcRiozShpN/story.html

Curriculum Tags: All
http://vimeo.com/93390473
http://vimeo.com/93532834

I like this math "takedown" of this motivational poster. It leads to a nice problem about comparing the volume of cylinders, spheres and cubes. Could be used in grade 9 math measurement or in grade 8 if you leave out the sphere.
Curriculum Tags: MPM1D, MFM1P, Gr8
https://twitter.com/dandersod/status/477024981042626560

Might as well have a graph about the World Cup. This is coming from the 538 blog where they predict the winner of the soccer tournament. And as they point out, you don't need a computer model to predict that Brazil is the heavy favourite (even after their controversial win over Croatia). Either way they go through the reasoning behind their prediciton
Curriculum Tags: Gr7, Gr8, MBF3C, MDM4U
http://fivethirtyeight.com/features/its-brazils-world-cup-to-lose/

538 keeps hitting with the data that has so much bearing on world events. Which is the blingiest NBA playoff matchup? That is which pair of teams has the most rings.
Curriculum Tags: Gr7, Gr8, MBF3C, MDM4U
http://fivethirtyeight.com/datalab/its-the-second-blingiest-finals-matchup-in-modern-nba-history/