Showing posts with label statistics. Show all posts

Friday, December 6, 2013

Math Links for Week Ending Dec. 6, 2013

OK, so I am not going to say much about the features of Math Disk except to say watch the video below and try not to be impressed with all it does. Ok, so maybe I will mention some of the features. Algebraic and numerical calculations, function and statistical plots, probability, dynamic geometry and 3D vector plots (amazing stuff ripe for MCV4U) and even physics simulations (you can actually play angry birds). There is an iPad version as well. Though it doesn't have all the functionality, by creating an account on your computer, you can open and manipulate any files on the iPad. That being said, because it does so much, there will be a bit of a learning curve to figure out how to use it. There are a number of support articles and of course there are a pile of how to videos. My only complaint about these is that there doesn't seem to be any verbal instructions. They just show you how to do things. So when I was trying to make a dynamic plot, I found it hard to just watch what they were doing and mimic it on my screen without watching a few times. But once I got the gist of what to do the graphs and sketches started to flow. And its totally free. Go ahead, try to not be impressed by this. Thanks to Free Technology for Teachers for pointing this out.
Curriculum Tags: All
https://www.mathdisk.com/


The second of two graphing applets today is called Plotly. Now I know in Ontario we have both Fathom and Tinkerplots to use freely at home or school and many of us also have Excel and possibly Google Docs now but this package does just about every type of graph relatively easily. That is something that none of the above mentioned can do. Excel is pretty good at making line, bar and circle graphs (same with Google Docs) and Fathom and Tinker plots are great for graphing microdata (scatter plots, histograms, box plots and dot plots). But Plotly does them all. Histograms, box plots, bar graphs, line graphs and my new favourite: heat maps among others. I do find it interesting that circle plots are curiously omitted (probably a nod to those statistics folks who think they are among the most misused and awful types of graphs). All of the graphs have mouse over features and can be customized. As an added bonus it seems to work fine on an iPad (sans mouse over features) and you can even import your data from Dropbox or Google Drive. I suggest looking gallery to see the scope of what can be done and at the tutorials to master any of the idiosyncratic features of making these graphs. And of course, don't forget to create an account to save all of your graphs.
Curriculum Tags: MDM4U
https://plot.ly/
Depending on how anal you are about pseudo random generators (purists among you will no doubt harp that any electronic random generator is not, in fact, random - and you would probably be right), you may think this is cool or useless. Flip a day has one purpose. To flip a real coin once per day and post the result. That's it. As of today they are at 220 flips. You can follow them on Twitter and download the csv file as well.
Curriculum Tags: MDM4U
http://flipaday.co/
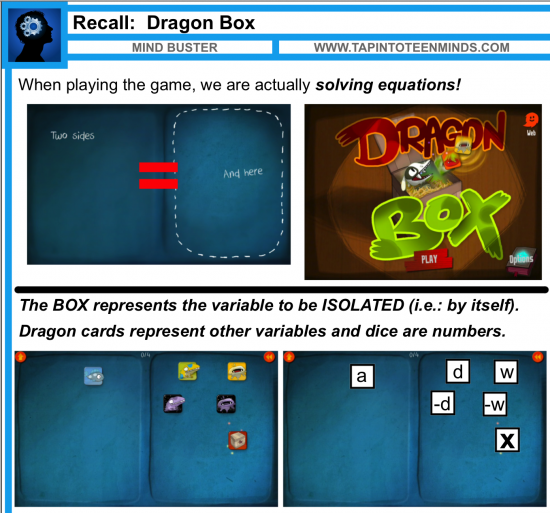
If you haven't used Dragon Box, I think you are missing out. I truly believe it is one of the best games out there that actually teaches a math concept. It runs on multi platforms and isn't that expensive. But how would you actually use it in a classroom to teach solving equations? Thanks to Tap into Teen Minds you are one step closer to figuring that out. Thanks Kyle
Curriculum Tags: Gr7, Gr8, MPM1D, MFM1P, MPM2D, MFM2P
http://tapintoteenminds.com/2013/11/24/how-to-effectively-use-dragonbox-in-your-solving-equations-lesson/


Do you need an example of something big to give some meaning to number sense calculations? Well how about info around the largest container ship ever built? Here are some stats over 1600ft long (longer than the Empire State Building is tall), 600 000 tonnes. It is basically a floating liquifying natural gas (FLNG) facility that mines, processes and can store up to 3.9 million tonnes of liquid natural gas each year. To get a sense of how much use out of that gas consider that the average family might use about 2000-3000 cubic metres of natural gas during the year (in gaseous form - click here to help convert that)
Curriculum Tags: Gr7, Gr8
http://www.wired.com/autopia/2013/12/worlds-largest-ship/


I love this "proof without words" of the area of the circle and how it can be connected to the area of a triangle. You probably could even get into some calculus talk in terms of infinitesimal slices of a circle to I guess
Curriculum Tags: Gr8, MPM1D, MFM1P
https://www.youtube.com/watch?v=whYqhpc6S6g

Friday, September 13, 2013

Math Links for Week Ending Sept. 13th, 2013

I am not sure how long this has been around but it seems to be a repository for all of the in house created sketches for GSP. Very inviting site and these sketches really exploit the power of Geometer's Sketchpad. There is stuff for all grade levels and even an indicator for those sketches that are iPad friendly.
Curriculum Tags: All
http://www.dynamicnumber.org/

Despite the title of this TEDx talk (Why Math Instruction is Unnecessary) I like how John Bennett takes us on his journey of discovery that much of the math that we teach is basically just a construct of our curriculum and not really necessary for everyday life. But the real focus of his message is that problem solving and critical thinking are.
Curriculum Tags: All
http://www.youtube.com/watch?v=xyowJZxrtbg

Many have long said that mathematics was the way to a high paying job. Well now I guess we have the data to prove it. The US Census has always asked about income and level of schooling but in their most recent surveys they have also asked what people's majors were. The Planet Money people have a great podcast on the results (long and short versions below). And the survey says: Applied math (engineering, computer science etc) seems top the list. What's at the bottom? Psychology. A couple of things that resonated with me about this were a) that, in general, it didn't matter where you got your degree and b) it really had more to do with supply and demand. If you want the actual pdf of the full study click here.
Curriculum Tags: All
Long version http://www.npr.org/blogs/money/2013/09/11/221417806/episode-485-whats-your-major
Short version http://www.npr.org/blogs/money/2013/09/10/219372252/the-most-and-least-lucrative-college-majors-in-1-graph

I am way behind on the I Speak Math blog posts but this one about how now there are more #mathchat had a Twitter chat about the math topic of the day. Now there are these more specific chats that go on. From middle school math all the way to calculus and statistics. Take a look here for your favourite topic.
specific "chats" about math on Twitter now. For a while every Monday and Friday (I think)
Curriculum Tags: All
http://ispeakmath.org/2013/09/02/weekly-math-subject-chats-are-live-now/

Another great TED talk about visualizing data. Chris Jordan is an artist who creates social commentary art that is often more than it seems (when you look closely at it). For example an image of the Titanic made of 67000 images of mushroom clouds (equal to the number of metric tons of uranium/plutonium being stored temporarily around the US). Check out his website (http://www.chrisjordan.com/) to be able to zoom into his works (there are a lot of them). Here is a perfect way to mix social justice and data management.
Curriculum Tags: MDM4U
http://www.ted.com/talks/chris_jordan_pictures_some_shocking_stats.html

"Would you rather...." is a blog that specializes in posing questions that asks the reader to make a choice of two similar situations and use math to justify that choice. There are a lot of different math topics that could be used here but it seems many fit into the Number Sense strand (I could be wrong here as I just skimmed the site). None the less these are great starting points for math conversations.
Curriculum Tags: Gr7, Gr8, MFM1P, MPM1D
http://wyrmath.wordpress.com/

These math "mysteries" are all really attainable for many students to understand (ie they can easily mechanically verify them) but they are some of the most famous unproven theorems. A neat way for students to see how proving something definitely can be very difficult. Included are the Goldbach Conjecture, Perfect Numbers and Mersenne Primes (plus people have suggested others)
Curriclum Tags: All
http://plus.maths.org/content/maths-minute-number-mysteries


I like this App to visualize Factoring from NCTM's Illuminations. Too bad it doesn't work on an iPad but its a nice visualization
Curriculum Tags: Gr7, Gr8
http://illuminations.nctm.org/ActivityDetail.aspx?ID=64


Here is a great way to introduce FOIL in secondary and in elementary I like the suggestion made by @emergentmath "Here's your lesson plan tomorrow: Stop the video after 1:30 and ask "why does this work?""
Curriculum Tags: Gr7, Gr8, MPM1D, MFM2P
http://www.youtube.com/watch?v=PYrgjMubh-c


I don't think you will ever need to describe how a Venn diagram works if you just show this example. There are more on the main site (http://stephenwildish.co.uk/) though not all dealing with data.
Curriculum Tags: MDM4U
http://stephenwildish.co.uk/images/holy.jpg

Redbull sponsored a contest to take the image of extreme thrill seekers in action. Some cool pix but this one fits quite well with modelling quadratics. Just import this into GSP or Geogebra and model the strobed snow boarder with a quadratic. Note that it may look kind of flattened out but that has to do with the fact that the snow boarder is rotating in flight. But it's the centre of mass that follows a parabolic arc.
Curriculum Tags: MPM2D, MFM2P, MBF3C, MCF3M, MCR3U
http://www.wired.com/rawfile/2013/09/red-bull/#slideid-39351


Friday, September 6, 2013

Math Links for Week Ending Sept. 6th, 2013

I really like this example from the Mathalicious blog (even though they make a spelling mistake in the title - though @mathtans suggests this is on purpose prisn = prison). I saw this graphic earlier in the week when the blogsophere was making fun of it but Mathalicious has found a way to make it relevant to the math classroom. It deals with the idea of false positives in large samples. I have always gravitated to these examples as they really accentuate the problems with any sort of testing where the results are based on a probability or percentage.
Curriculum Tags: MDM4U
http://www.mathalicious.com/2013/09/prisn/


I have been starting to create some simple Geometer's Sketchpad files that could be used as a Minds On or intro to lessons. This one is a simple sketch that allows students to visualize a guess of how big a percentage is. They can check their answer, get a hint and then reset the question so it randomly changes the situation. It was designed to use the iPad version of GSP, Sketch Explorer. Try it out
Curriculum Tags: Gr7, Gr8, MPM1D, MFM1P, MAT1L
http://sketchexchange.keypress.com/sketch/view/823/percent-guesser

Here is a nice application of percent that is very real world. Dealing with percents of percents when talking about resource use on an Android phone.
Curriculum Tags: Gr7, Gr8, MPM1D, MFM1P, MAT1L
http://www.androidcentral.com/new-google-services-uses-more-battery-old-and-google-needs-fix-battery-screen-already


I like this activity because its hands on and its about sampling. Specifically dealing with the idea of the effects of sample size. Thanks to Dan Meyer for this one.
Curriculum Tags: MDM4U
http://17goldenfish.com/2013/04/23/first-past-the-post-and-the-dreaded-disease-z/


Here is a nice real world optimization problem that deals with perimeter, area and money. Basically, how much money would you save to try to build this playpen on your own. Thanks to Dan Meyer for this one too.
Curriculum Tags: Gr7, Gr8, MPM1D, MFM1P
http://mtsmc.blogspot.ca/2013/04/patio-math-toddler-edition.html


I don't want to spread negativity but this blog post about a Khan Academy video seems right on. It kind of exemplifies how the Khan videos are not really stelar in terms of the teaching (in this case having out right mistakes). They serve a purpose but they shouldn't be your go to resource. But that is not really why I like this post. I liked it because it uses something I hadn't heard of before (or at least didn't know the name of before). Using a two-way table instead of a Venn diagram. I agree that this seems to be way more informative than the Venn diagram. Check it out.
Curriculum Tags: MDM4U
http://learnandteachstatistics.wordpress.com/2013/09/02/khan-academy-probability/


There has been a lot of blog posts about analyzing Double Stuffed Oreo's to see if they are actually double stuffed. Here is a tweak dealing with systems of equations.
Curriculum Tags: MPM2D, MFM2P
http://christopherdanielson.wordpress.com/2013/09/04/college-algebra-with-christopher/


Yummy Math has a nice activity that uses an infographic from visual.ly about the amount of caffeine in various coffees. As it is with all Yummy Math activities there is a worksheet but if you want the solutions and an editable version of the worksheet.
Curriculum Tags: Gr7, Gr8
http://www.yummymath.com/2013/how-much-caffeine/


I think that these four suggestions are good though more relevant as kids are younger. I certainly agree that speaking well of math is the first step. We have an uphill battle in the math arena since most people have an easy time dissing math and of course that filters down to kids and then we get them as students. But I like the suggestion to play games. Using dice, cards, and problems solving skills on a regular basis is going to help kids in math class. Check out the other tips here.
Curriculum Tags: All
http://www.edudemic.com/2013/08/four-tips-parents-encourage-math-skills-home/

I think this building was designed by Dr. Heinz Doofenshmirtz. An application of parabolic focussing.
Curriculum links: MFM2P, MPM2D, MCR3U, MCF3M, MBF3C
http://io9.com/new-skyscraper-unexpectedly-generates-a-solar-beam-that-1263670017

Here is a scientific and topical example of periodic phenomenon. The reversing of the Sun's magnetic field. Could possibly be modelled with a sinusoidal function with a period of 11 years. Thanks to Joe Goulet for this one.
Curriculum Tags: MCR3U
http://blogs.smithsonianmag.com/science/2013/09/the-suns-magnetic-field-is-about-to-reverse/

Friday, February 8, 2013

Math links for the Week Ending Feb 8th, 2013


The first of two really good 3Acts Tasks from Dan Meyer. The first one is perfect for intersection of lines. Click here for the first act video. Click on this link for the full task
http://threeacts.mrmeyer.com/ditchdiggers/
Curriculum Tags:MFM2P, MPM2D


In the 2nd 3Acts Task, Dan uses bubble wrap to generated quadratic data. Below is the first video. Click here to see the entire task.
http://threeacts.mrmeyer.com/bubblewrap/
Curriculum Tags:MFM2P, MPM2D


Act 1 — Bubble Wrap from Dan Meyer on Vimeo.

This site gives a visual view of the real time traffic on Twitter. A really nice non standard representation of data
Curriculum Tags: Grade7, Grade8, MDM4U

We don't know what the largest prime number is but recently we discovered a new largest known prime. It has over 17 million digitshttp://lightyears.blogs.cnn.com/2013/02/06/largest-prime-number-yet-discovered/
Curriculum Tags: Grade 7, Grade 8

Indexed has always been a quirky site. With its venn diagrams and emotional graphs. Here's one that could be related to quadratic relations.
http://thisisindexed.com/2013/02/how-to-say-everything-without-a-word/
Curriculum Tags: MPM2D, MFM2P

Friday, January 25, 2013

Math Links for Week Ending Jan 25th, 2013

Math in the News is a website that puts out a slideshow on a semi regular basis. The slideshows indicate instances where math shows up in the news and includes ideas of where to incorporate them in math curriculum. The most recent one is from November of 2012 and of course includes info about the election. Currently there are 67 of these slideshows so there is quite a back catalog to get caught up with
http://www.slideshare.net/Media4Math/
Curriculum Tags: All

I know that I have already mentioned the Wild About Math blog but they have just uploaded another Inspired by Math interview. This time with Keith Devlin (The Math Guy -among other things). In this almost 2hour interview Keith talks extensively about teaching his MOOC (massively open online course) Introduction to Mathematical Thinking to over 64,000 students. I have blogged a bit about the concept here but this was really interesting to hear some of the logistical aspects. For example, he talked bit about the validity and method for students grading each other.
He also said a couple of things that really resonated with me. I will paraphrase here "Learning math is like learning to ride a bike. You can't learn by just having it explained to you. You have to try it and fail at it and try it and fail at it and then finally you will learn to ride a bike and you will never forget how to do it again" and "In high school I aced my calculus courses but didn't understand calculus until I was a graduate student TAing a calculus course"
Look for his new Math gaming app which should be coming out in about 3 weeks.
http://wildaboutmath.com/2013/01/22/keith-devlin-%E2%80%93-inspired-by-math-17/
Curriculum Tags: All

Here is a great site to get some sinusoidal (and maybe some linear) data for analysis. In fact, I got the sunrise sunset data for Windsor, massaged it into a spreadsheet and then created a Fathom file for you here to use. Have fun. Sundata.csv, Sundata.ftm
http://www.timeanddate.com/astronomy/
Curriculum Tags: MCR3U, MCF3M, MHF4U


With the Superbowl coming up, I thought I would share a slideshow I made for the 2008 Superbowl on all the different ways the money is spent on that one weekend.

Curriculum Tags: MDM4U


I am not completely sure how this could be used in a math class but I was fascinated by the connection of math and economics to show that LeBron James is actually severely underpaid at $17M per year. I am pretty sure you could tie this into statistics. Listen to NPR's Planet Money story here:
http://www.npr.org/blogs/money/2013/01/25/170176590/at-17-5-million-a-year-lebron-james-is-underpaid
Curriculum Tags: MDM4U


Dan Meyer did a nice montage of disparaging marks against math in the movies. One of the neat things about this clip was the website Subzin. On that site you can enter any words or phrases and it will search out where and when that appeared in their movie database.
http://blog.mrmeyer.com/?p=16222
Curriculum Tags: All

Another nice video from The Art of the Problem. This time on using tree diagrams with conditional probability.
http://www.youtube.com/watch?v=Zxm4Xxvzohk
Curriculum Tags: MDM4U